.svg)
GDPR compliance isn't just about creating policies and implementing technical controls; it requires ongoing risk management. It's impossible to guarantee 100% compliance, as it's a constant and changing process, reflecting data flow, new regulations, process and technology changes within the organization, and other factors. Therefore, risk management must be clear, transparent, and based on reliable metrics.

In this scenario, having a risk matrix integrated into project management software becomes essential. When presented visually and interactively, it provides data protection consultants and compliance teams with a panoramic and detailed view, enabling quick and informed decisions.
What is the Risk Matrix?
The personal data protection risk matrix is a visual and strategic tool for identifying, classifying, and prioritizing risks related to processing activities, incidents, reports of irregularities, and others.
These metrics, presented visually in colors, graphs, and heat maps, instantly highlight the most critical points, as well as the most contained ones, of the adequacy topic being analyzed, and can be divided into 5 main steps:
1. Risk mapping
The matrix maps all risks associated with data processing activities, potential security incidents, data subject reports, or signs of non-compliance, and generates results based on impact and probability analysis.
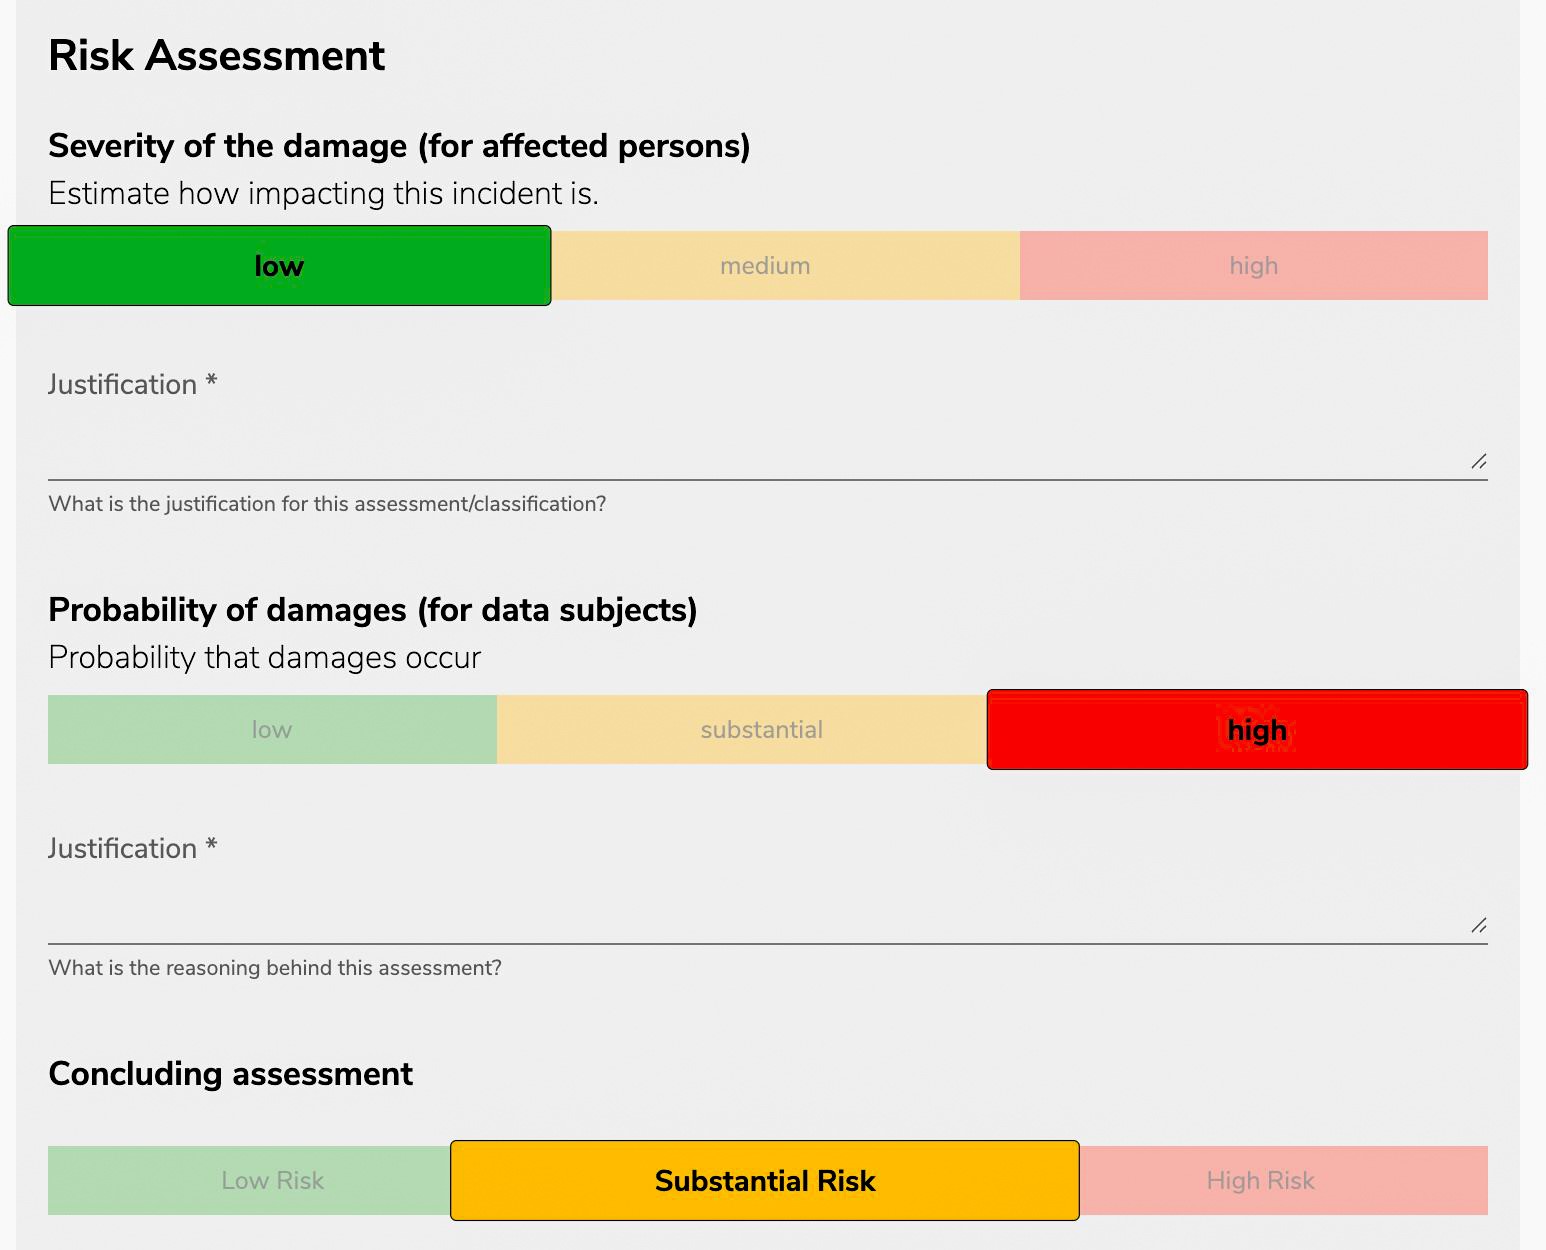
2. Impact Assessment
Impact measures the severity of the consequences if the risk materializes, and may include the description of damage to privacy, financial, reputational, or operational impacts, and legal repercussions, such as fines.
A security incident involving a lot of sensitive data will have a much greater impact compared to one involving only public data, for example, and will be indicated in the matrix graph by warmer colors, such as red.
3. Probability Assessment
Probability measures the chance of the risk occurring. An activity that involves the massive processing of personal data across multiple systems without robust technical controls has a higher probability of incidents.
4. Construction of the Matrix (Impact x Probability)
Risks are positioned in a matrix, which crosses impact and probability, allowing them to be classified as insignificant, low, medium or high levels, as can be seen in the matrix generated by Ecomply below:
- High impact + High probability = critical risk → requires immediate action.
- Low impact + Low probability = acceptable risk → only monitoring.
5. Decision making and action plan
The matrix guides managers and DPOs in prioritizing efforts, applying more rigorous technical, administrative, and legal measures to the most significant risks. It also allows them to justify decisions to accept or mitigate risks before auditors and regulatory authorities.
How the Ecomply risk matrix contributes to the management of compliance projects
Considering that one of the premises of a GDPR compliance project is to reduce risks and vulnerabilities related to personal data processed by an organization, by identifying and mitigating them, Ecomply developed a robust risk matrix for its systems.
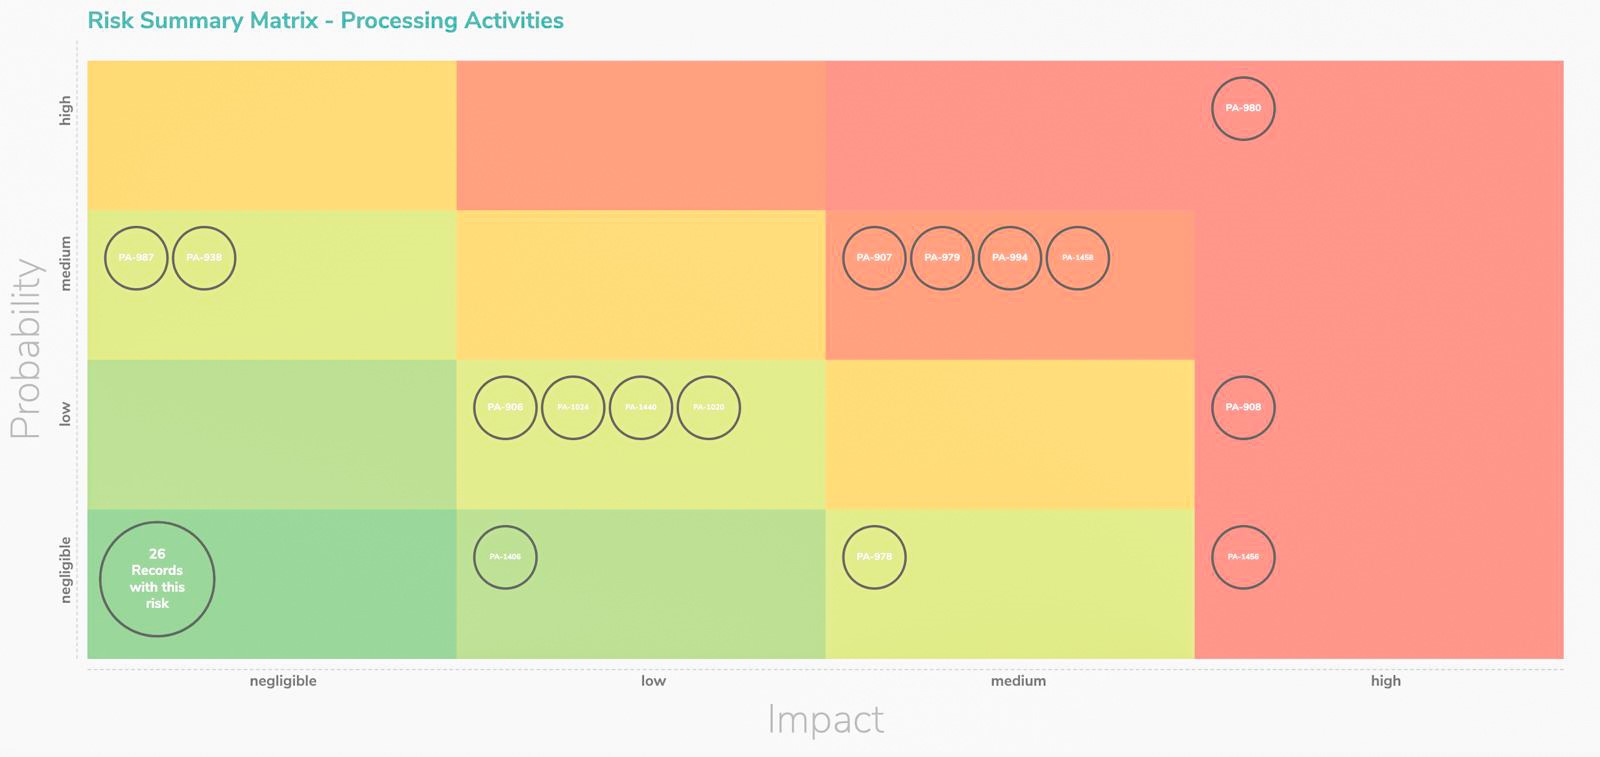
In addition to the individual matrix for each processing activity, it is now possible to view the distribution of all processing activities based on the summary, which weighs probability and overall impact. In the context of processing activities, the matrix helps identify large-scale or sensitive data processing requiring stricter controls, as well as prioritize which processes require Risk Impact Assessment (RIPD/DPIA).
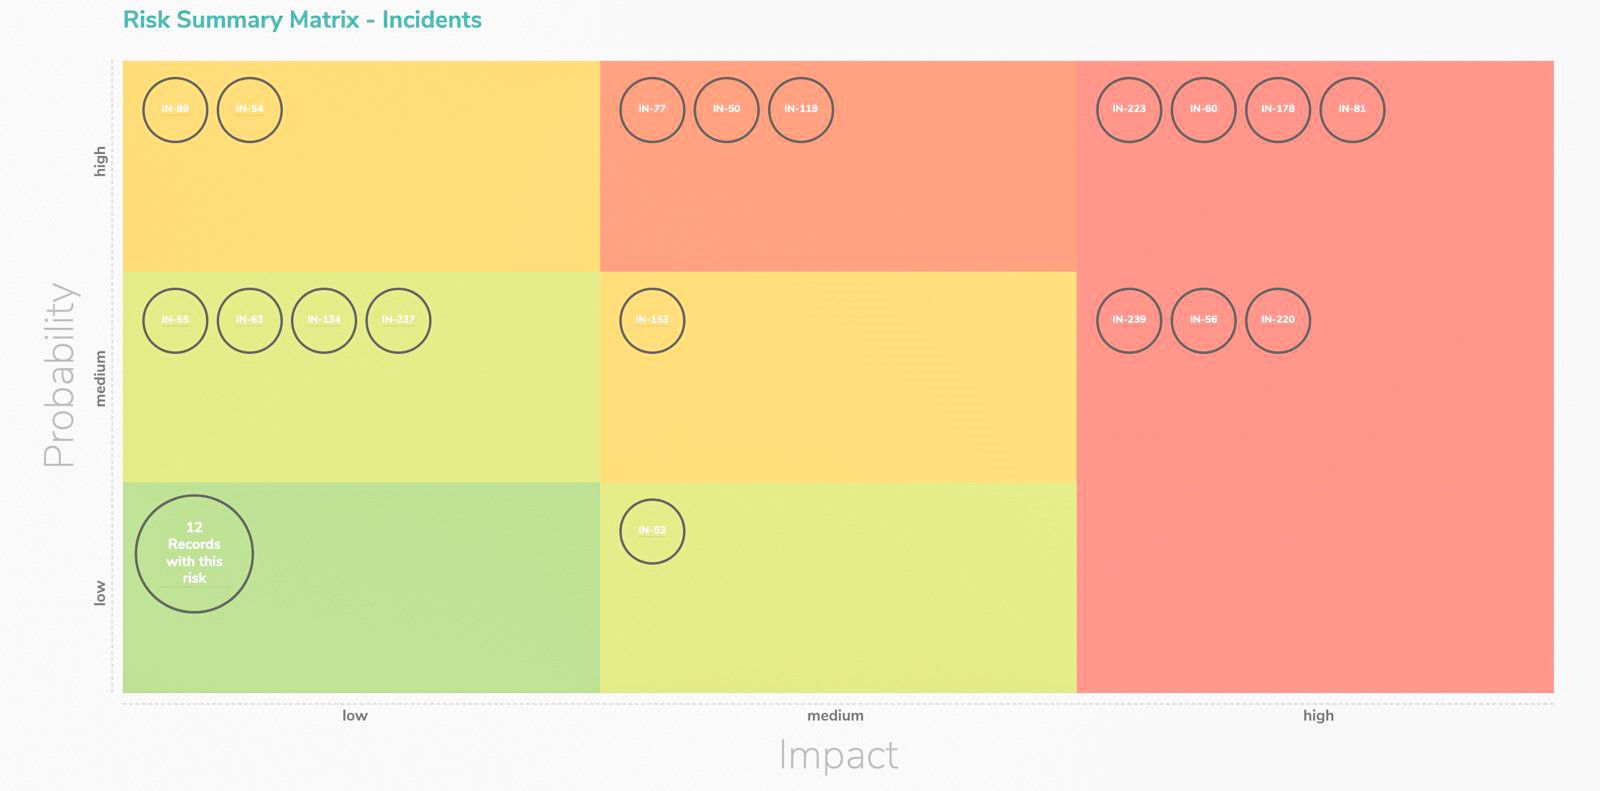
The matrix also analyzes incident records, which are those related to security breaches, unauthorized access, data loss, cyberattacks, or human error. In this case, the matrix is relevant when measuring the probability of the risk described and the impacts that the incident generated or could generate if quick measures are not adopted.
The matrix helps prioritize incidents from most severe to most contained, reducing response time and costs, and providing greater resilience to the organization when dealing with adverse situations.
Finally, the reporting matrix reports records of irregularities and internal or external complaints, helping to measure the efficiency of the service provided to the whistleblower and contributing to the principle of accountability by demonstrating that the company received, responded to, and corrected errors.
Main advantages of a risk matrix
1. Clarity and objectivity in prioritization
The visual matrix organizes risks into levels, allowing you to quickly identify which treatment activities, incidents, or reports require immediate action. Instead of scrolling through extensive reports, the consultant can focus their efforts on the most pressing issues in seconds, by analyzing the matrix and developing measures to mitigate the identified risks.
2. Dynamism in updating
The risk matrix is dynamic and automatically updates its indicators whenever new incidents are reported, complaints are filed, or processing activities are registered, reducing manual analysis time. Thus, the matrix is not a static document, but a living risk dashboard that reflects the organization's reality in real time.
3. Support for strategic decision-making
By visualizing risks in graphical format, managers and DPOs can:
- Compare areas and processes: identify the most vulnerable sectors within the organization;
- Define investment priorities: know where to apply information security resources or training first;
- Plan mitigation actions: organize action plans according to the mapped risk level, reduce the chance of serious incidents, and prepare the organization to respond to reports in a structured manner;
- Sanctions prevention: Helps identify failures before they become serious violations.
4. Team engagement
The simplified visualization facilitates communication with non-technical areas. Instead of explaining complex reports, the consultant can present the matrix strategically in meetings, making risks tangible and understandable for directors, managers, and employees, increasing engagement and a sense of collective responsibility, and facilitating audit reporting.

5. Continuous evolution
The matrix also serves as a historical record to assess whether the implemented measures are reducing risks over time. If one month the probability and impact of 10 processing activities were extremely high, and the following month only two records appear in this quadrant, for example, this means that the measures adopted were effective.
Focus on what matters to protect data
Ecomply's visual and dynamic risk matrix promises to serve as a strategic guide and support resource that will become indispensable to your organization from the very first contact. It makes the compliance process more agile, clear, and efficient, ensuring continuous monitoring and, consequently, greater safety and agility in damage containment.
The risk matrix is like a compass for data governance, as it directs where the organization should focus resources and efforts with more urgency and rigor, and where it can simply monitor, keeping the adaptation process sustainable and balanced.
In addition to strengthening the compliance project, the matrix increases the confidence of data subjects and authorities and helps companies maintain a proactive stance in the face of privacy and data protection challenges, by clearly visualizing the overall situation generated by that particular metric.
Discover ECOMPLY's new Risk Matrix and several other GDPR management tools that will help your organization stay ahead of the curve and ensure compliance is always as close to 100% as possible.
ECOMPLY is a GDPR compliance management software that assists in building and maintaining compliance documentation. Check out our website or contact us for more information.
